Examples of evaluation method
Data evaluation
Firstly, activating waveform environment.
1$ conda activate waveform
2$ cd /workspace/GWAI/docs/source
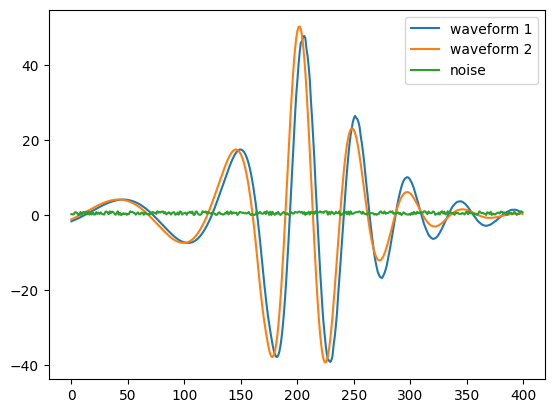
Then, loading demo data of waveforms: w1.npy, w2.npy, noise.npy, and plotting waveforms and noise.
>>> import matplotlib.pyplot as plt
>>> w1 = np.load('docs/source/w1.npy')
>>> w2 = np.load('docs/source/w2.npy')
>>> noise = np.load('docs/source/noise.npy')
>>> print('w1 shape: ', w1.shape)
w1 shape:  (400,)
1import matplotlib.pyplot as plt
2plt.plot(w1, label='waveform 1')
3plt.plot(w2, label='waveform 2')
4plt.plot(noise, label='noise')
5plt.legend()
6# plt.savefig(f'demo.png', dpi=100)
7plt.show()

Tukey Filter
1import matplotlib.pyplot as plt
2tmp = tukey(w1.shape[0], alpha=0.8)
3plt.plot(tmp*w1, label= 'after filtering')
4plt.plot(w1, label='original waveform', alpha=0.8)
5plt.legend()
6# plt.savefig(f'tukey.png', dpi=100)
7plt.show()

SNR
>>> snr = get_amp_snr(w1, noise)
>>> print('snr: ', snr)
snr:  25.198280479785378
Model evaluation
MSE Loss
>>> pred = torch.tensor(w1.reshape(1,-1))
>>> label = torch.tensor(w2.reshape(1,-1))
>>> mse = mse_loss(pred, label)
>>> print('mse loss: ', mse)
mse loss:  tensor(44.5499, dtype=torch.float64)
Downstream task evaluation
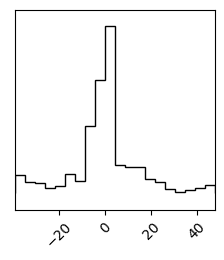
Corner plot
1corner_plot(w1)